



Notes for hoteliers
OTB: what “on the books” means and why you should watch your future bookings

RDNE Stock project / Pexels
High season is still four months out, and the Planner for those weeks is empty: twelve rooms, not a single booking. The first reflex is to cut prices before it is too late. The second, if you take a breath, is to wait — last year May looked the same, and by July there wasn’t a room left.
Both reactions rest on the same evidence: none, until a number is in hand. Not “how much did we sell last month” — that is occupancy, and it looks backward. What you need is a metric about the future: how much is already sold for a specific date, and how fast it is growing. It is called OTB (on the books) — literally, “already in the book.”
Here is what sits behind the abbreviation, how OTB differs from occupancy and the booking window, how to take readings by hand on a 10–30-room property, and what to do when the numbers trail last year’s.
What OTB is, in plain words
OTB is the bookings already confirmed for a specific future date, as of the moment you look. The definition fits in one line, but three words in it trip up most readers.
Confirmed. OTB holds what already stands in your Planner: bookings from your site, from the channels, the phone calls you wrote down. Not what “will probably happen”: inquiries without a booking, hopes pinned on a conference in town, the wish that September fills up by itself.
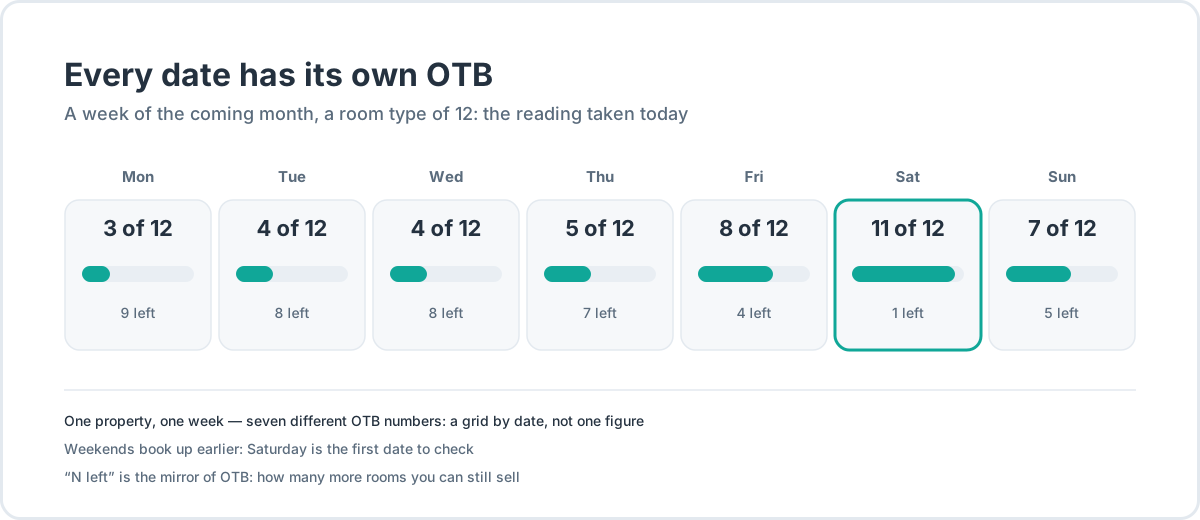
A specific date. OTB is not one number for the whole property — it is a grid by date. Saturday and Monday of the same week live separate lives, and a single averaged figure hides that difference.
The moment of measurement. It is a snapshot, not a constant: tomorrow the picture is different. So OTB is never “looked at once and forgotten” — it is retaken, always under the same conditions.
OTB is usually counted in room-nights: how many nights are sold for a given date. The second version is money: what those bookings are worth at their rates. Both are standard in the industry, but for a small property room-nights are the practical choice — visible in the Planner without arithmetic, with the money computed on top.
A mini-example to pin down the units. On a mid-season Saturday, a room type of 12 rooms holds four bookings covering that night. OTB in room-nights is four. At their rates the same bookings come to, say, €340 — OTB in money, revenue on the books. Both records say the same thing in different units: the second demands current rates and melts with every cancellation, the first asks only for a glance at the Planner.
Some translated articles attach the word “index” to OTB. There is no index here — there is a level of sales for a date. And it is not a forecast: future cancellations are not subtracted from it. In industry breakdowns of forecasting, what is already sold today is one input of the forecast, next to booking pace, historical bookings, expected cancellations and the events calendar. An input is not a result: a forecast assembles several such pieces, and OTB is the most honest of them — a fact, not an expectation.
Cancellations are where the main caution lives. OTB is not “cleaned” of expected removals: a cancellation three weeks from now is invisible in today’s figure — it surfaces in one of the following readings. No single number taken a month before arrival settles the outcome: the outcome is judged by the movement.
How OTB differs from occupancy and the booking window
Three metrics most often blurred together in talk about future dates:
| Metric | The question it answers | Where it comes from |
|---|---|---|
| Occupancy | What share of the inventory was sold over a period | Computed from past dates: sold room-nights ÷ available room-nights |
| OTB | How much is already sold for a future date | The Planner: bookings on future dates |
| Booking window | How far ahead guests book | The gap between the booking date and the arrival date |
Occupancy looks back, OTB looks forward, and the booking window is not about sales at all — it is about guest behavior: when your guests are used to booking. The formulas and classic mistakes of occupancy are a separate topic, unpacked in the ADR article.
The booking window matters here for one reason: it sets the horizon worth watching at all. By industry data for 2025, independent properties received bookings on average 40 days before arrival, against 38 two years earlier; in North America the window is longer — 48 days, in EMEA — 47. Another industry report, built mostly on European properties, gives a similar picture: 41 days in 2024, 40 in 2025, with almost 40% of bookings arriving within the last week and about 13% same-day.
One universal “average” does not exist here and cannot. A 2025 industry report puts the global average at 32 days — but its sample spans 20 markets, and the spread is enormous: Ireland at 46 days, Asian markets noticeably shorter. Corporate travel is a different story: by HotelHub’s data, corporate and agency bookings in 2024 arrived on average 16 days out. Typical ranges from industry materials: leisure 21–45 days, corporate 7–14, groups and conferences 90–180; the window lengthens in high season and shortens in the low one.
The window also “breathes” within a year: by one report’s measurements, the average window for the US Easter dates of 2026 came out 11% shorter than the year before. Same dates, same market — guests just booked later.
The practical conclusion outweighs anyone’s averages: your window is yours. Look at your own bookings, see how far ahead of arrival they come in, and watch exactly that horizon. For most independent properties it is one to two months out — earlier ahead of big events.
Booking pace: why one reading says nothing
Say the Saturday a month out has 4 of 12 rooms sold. Is that a lot or a little?
With no other information — unknowable. If last year at the same depth it was 9, the picture is alarming. If it was 2, you are running ahead. If yesterday it was 2 and today it is 4, the question has answered itself. A level becomes a diagnosis only next to a second number.
That second number is booking pace: how many bookings for a specific date were added between two readings. For the nearest dates it goes by pickup: “23 room-nights sold for the coming Friday over the past week” is the classic example from an industry guide.
The difference between a level and an increase is the fork in the whole topic:
- OTB is the accumulated level: how much is already there for the date.
- Pace is the increase: how much was added since the last reading.
A level without pace deceives in both directions. A sellout six months before arrival can read as “the season is won” — when in fact it is an early corporate block that falls apart a month later. A zero a month out can trigger panic and price cuts — when your guests, by habit, book in the last ten days.
An industry guide for independent hotels puts it in working language: the nearest dates daily, five to ten minutes; the 14–30-day range, weekly. Not because the numbers move fast — because the diagnosis lives in the difference between readings.
Alongside pace, keep a list of guests who wanted a date and did not book — regrets and denials in industry jargon. A regret: the rate or the terms did not suit the person. A denial: there was no room at all. The first speaks about price, the second about occupancy. Five refusals in a slow week on empty dates mean demand exists and the offer missed it — rate, terms or channel aimed wrong. Five refusals in a peak week with a full house mean the opposite: the rate for that date is ready to move up.
Comparing with last year: a table of five readings
The same period last year (STLY in industry texts) is the small property’s main baseline. You do not know your competitors inside out, market reports are not written about your town — and last year’s own numbers are the only comparison where you control both sides.
Two rules, without which the comparison becomes self-deception.
The same depth. Compare not “June 5 this year against June 5 last year,” but “28 days before arrival” against “28 days before arrival.” Otherwise you are comparing different stages of the pickup and getting noise.
The same day of the week. The calendar shifts: last year’s Saturday is a Tuesday this year. Compare the same position in the week — Saturday with Saturday, the first Saturday of the season with the first Saturday of the season. Industry guides warn directly: calendar shifts, weekdays and market conditions make last year a treacherous baseline taken unadjusted.
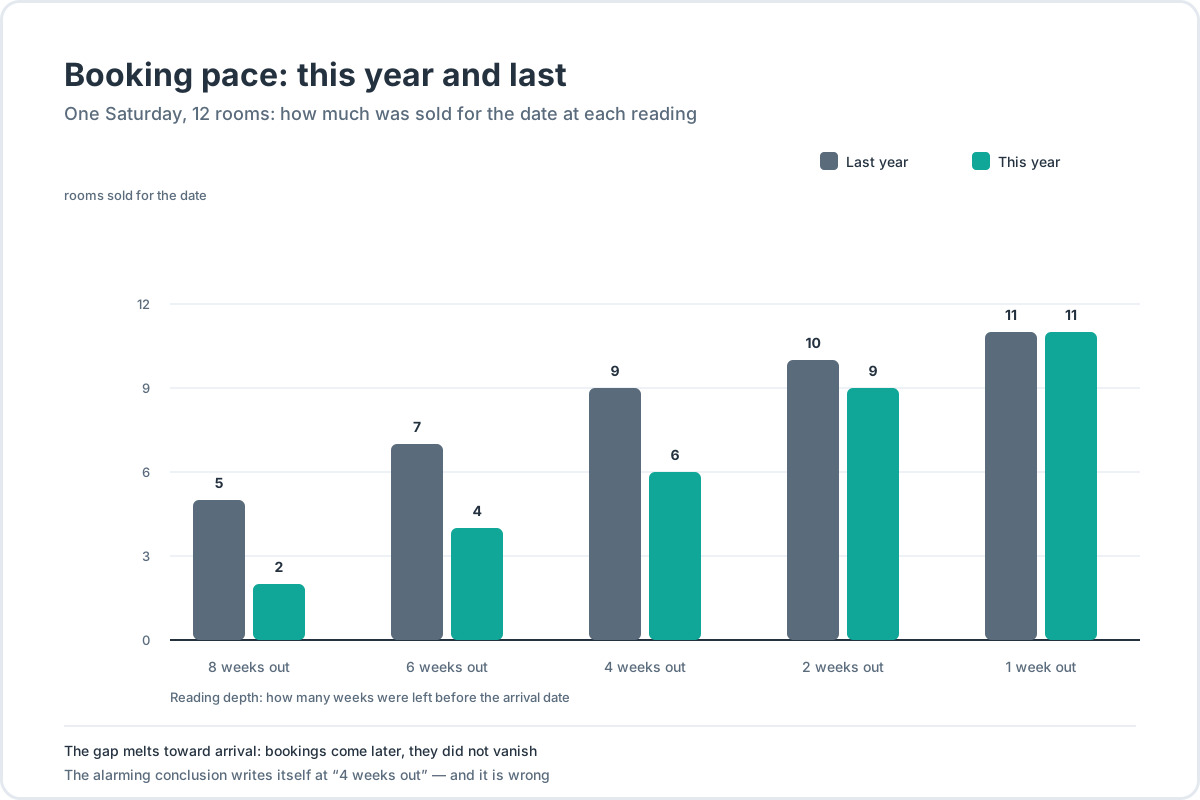
Now the table you can genuinely keep by hand: a Saturday in the middle of high season, a room type of 12 rooms, readings taken on the same weekday at the same time.
| Reading | Sold this year | Sold last year | Difference |
|---|---|---|---|
| 8 weeks out | 2 | 5 | −3 |
| 6 weeks out | 4 | 7 | −3 |
| 4 weeks out | 6 | 9 | −3 |
| 2 weeks out | 9 | 10 | −1 |
| 1 week out | 11 | 11 | 0 |
Read it the way an owner reads it in real time, not a year later.
At the four-week reading you see 6 against 9 — a third down on last year, the third time running. The natural reaction: cut the rate. The right one: look at the two bottom rows first. The gap is melting, and on the home stretch your pace is higher than last year’s. People are simply booking later — the window shifted, not the demand. A price cut at “four weeks out” would have given away margin for something that was going to happen anyway.
The table reads the other way too: a year running steadily ahead is the signal to raise the rate earlier than last year’s schedule — and to stop handing early-booking discounts to guests who would have come anyway.
Two habits from practicing revenue managers are worth borrowing. Compare not only with last year but with last week of this year — a one-week shift shows the fresh increase with no calendar corrections. And smooth the increases with an 8-week moving window, so one large booking does not look like a trend. On 12 rooms every number twitches — smoothing only helps.
One question remains: where last year’s column comes from. If the records were kept — from the records. If not, they cannot be rebuilt: a small property’s system keeps no occupancy history by date, and last year’s numbers never written down are gone for good. That is not a reason to postpone. Start the table now, and in a month you have your first line of comparison — after a full season, a baseline that beats any market report.
Diagnosis: the season is sold, but revenue did not grow
A familiar story: by May, July is fully sold — and at the end of the season the till disappoints. The rooms went; the money, not quite.
The diagnosis runs through one pairing: occupancy × ADR = RevPAR. ADR is the average rate of a sold night; RevPAR is revenue per room in the inventory: income divided by all rooms, not only the sold ones. If occupancy reached one hundred percent while revenue per room grew less than it could have — the inventory sold too cheap. Not “a bad season,” but a squeezed rate: the dates were given away to early discounts and cheap channels in the first months of the pickup. The formulas and their mistakes are unpacked in the ADR article.
The early OTB readings show how it happens. A full house half a year before arrival is almost always early business: corporate blocks, non-refundable rates, discounted early bookings. None of that is bad in itself — it turns bad when an early price meets an early channel: discount plus commission eat the margin twice.
The mirror diagnosis: the rate stands high, the pace sits at zero, the dates empty out. Do not rush to “the price is too high” — check the comparison first (same depth, same weekday), then the channels and the terms.
And one detail only pace shows: releases. 21.8% of OTA bookings get canceled, against 10.6% of direct ones, and the average time before cancellation has grown to 39 days — industry data for 2025. A room sold in March for August can return to sale in July — and whoever takes readings weekly sees it in advance, not on the day of arrival.
Pace ahead or behind: what to do with the price
Numbers for their own sake interest nobody, so from here — decisions. Two directions.
Pace runs ahead of last year. The classic mistake is to relax: “the season will carry itself.” The market works the other way: demand is assembling faster, and the rate goes up earlier, not later. In practice:
- raise the rate where the gap is visible — earlier than last year’s schedule;
- set a minimum stay on the most expensive dates, so one short night does not eat its neighbor;
- close arrivals on a peak date if it would otherwise sell alone;
- check which channels take the early bookings: if everything lands in commission-bearing channels, part of the margin is given away for nothing. The direct guest is the only booking without a channel commission; where direct sales come from — the Booking Engine page.
Large properties practice last-room value: when a date is nearly sold, the last one or two rooms go at a premium — they close the last of the demand. An industry example: a fully sold weekend where the last room is held at $350 instead of the usual $180. On twelve rooms the mechanics are the same — only the decision is yours, not a system’s.
Pace trails. The order of actions is the reverse of the order of wishes — not “cut the price” but:
- Check the comparison. A different depth, different weekdays, a different event nearby or road repairs this year — the three most frequent causes of a false alarm.
- Check the channels. Did one of them drop off, have cancellations grown, did sales close by mistake.
- Check the terms, not only the price. Minimum stay, closed arrivals, stale rate plans on the dates — frequent culprits that all look like “there is no demand.”
- And only then the rate. If demand is genuinely slack, move the price instead of waiting: a week without bookings is data too.
One more reason not to hurry the last step. A fall 2026 industry outlook states the risk plainly: demand can turn within days, and a property watching only a few days ahead is left with a single tool — the last-minute discount. Early readings are exactly the way not to end up in that position.
The big football season showed how this plays out: early booking pace for the 2026 World Cup ran below expectations, as Hotel Dive reported, and hotels began returning reserved room blocks to open sale long before the matches — without waiting for the undersell to become obvious. No in-house analytics needed — the habit of checking pace against the plan is enough.
The rhythm: Monday morning and Friday evening
From guides and practice, a simple routine assembles.
The nearest two weeks — most often. Industry advice says daily, five to ten minutes: the decisions here are the most urgent (an undersold Friday, a room free tomorrow), and the check is one glance.
Dates 14–30 days out — once a week: enough to catch a shift in pace and still act, with two to four weeks in reserve.
Peak season, events, school holidays — daily. Industry materials give the same rule for properties without an RMS: weekly or once every two weeks at minimum, daily at the peak. The full weekly rhythm — daily, weekly and monthly slots — is unpacked in the revenue management guide.
This season’s context pushes the same way. According to UN Tourism, international travel grew 2% in the first quarter of 2026, and Europe took over 130 million guests — 4% more than a year earlier. The demand is there; the question is when it reaches your date — exactly what pace shows.
When to look is a matter of habit, but the week has two convenient windows. Monday morning: the past week is visible at once, with five days before the nearest weekend — time to fix what you spot. Friday evening: the second slot, if you want to influence weekend sales while guests are still choosing plans. One of the two is enough — the slot just has to stay the same, or the comparison drifts apart.
The reading itself takes ten minutes. Open the Planner on the coming four weeks and write down for each date: how many sold, out of how many. Compare the row with last week and with the same depth last year; mark the dates with zero increase and the dates where less than a third of the rooms are still available. Then work the marks: price and terms for the first, channels and minimum stay for the second. In a month you have the table from the previous section — decisions instead of guesses.
What this looks like without an analytics system
Honestly: HotelsCalendar has no ready-made OTB report. No revenue analytics, no occupancy percentages, no demand forecast — as in most systems for small properties; chain-grade management analytics is not something to expect from this class of software, and that is not a bug, it is a size.
What there is: the Planner, where bookings from every channel are visible on any future date. The “Today / On date” panel switches the view to a chosen date and shows the counters — check-ins, check-outs, who is in the house, the balance due; in period mode (1 day, week, two weeks, month) — a bookings counter and room-type headers like “Room type · N/M”: N is the rooms with a booking in the period, M the total (over a period, N counts rooms occupied at least one night of the range — so take an exact occupancy percentage one day at a time). The “Rates in cells” toggle puts each date’s price and availability into the cells — the mirror quantity of OTB: how much can still be sold. The bookings list exports to CSV for a period, by arrival dates — for those who prefer a spreadsheet. The dashboard shows today only: check-ins, check-outs, guests in the house, rooms free, bookings with a balance due.
That is enough for the readings: open a future date, write down the number, compare in a week. The computation is ten minutes a week — for a 9–30-room property, normal practice, not a compromise. How the Planner works and what surrounds it — on the PMS page; where the rest of a small hotel’s software fits — in the article on software for a small hotel.
Frequently asked questions
Is OTB a count of bookings or revenue?
Both: the industry uses “rooms on the books” (room-nights sold on future dates) and “revenue on the books” (their value at the rates). For a small property, room-nights are the practical unit — visible in the Planner, with the money computed on top in a spreadsheet. Which metrics to count by hand, and how — in the ADR article.
How is OTB different from occupancy?
Occupancy is the share of the inventory sold over a past period — a metric with a formula and a denominator. OTB is a snapshot for a future date: how much is already sold at the moment of reading. One looks back, the other forward; together with ADR they give the picture behind pricing decisions. How the metrics work as a set — in the revenue management guide.
How do I see future bookings if there is no ready OTB report?
In the Planner: switch the view to a future date and read the “In the house” counter and the “Room type · N/M” headers. For a list of future arrivals — the CSV export. Occupancy percentages and summaries the system will not compute — those are done by hand: occupied rooms ÷ all rooms. The period caveat: over a week or month, N counts rooms occupied at least one night of the range — take exact percentages one day at a time, not from N/M over a range. What is visible in the interface — on the PMS page.
Why watch OTB if bookings get canceled anyway?
That is exactly why. Cancellations are subtracted not from the metric but from your plan: today the date holds 11 rooms, in three weeks it may hold 9 — and the released nights must be resold in time. By industry data, 21.8% of OTA bookings are canceled against 10.6% of direct ones, and the average time before cancellation is 39 days: releases arrive early and show up in the readings. Why channels have a different cancellation profile — in the article on OTAs.
What OTB counts as normal?
There is no universal number: for a 12-room property and a 200-room resort it differs by definition. You compare not against a norm but against yourself — the same period last year, and last week — watching not the level but the pace of the pickup. The rhythm of checks and the diagnosis by metric pairings — in the revenue management guide.
OTB trails last year — cut prices right away?
No. First the comparison: the same depth before arrival, the same weekday, the same events nearby. Then the channels and the terms — minimum stay, closed arrivals, stale rate plans. And only then the rate, if demand is genuinely slack: an early discount on a date that would have filled itself is margin given away for nothing. How to assemble a room’s price and what levels it has — in the article on room rate pricing.